graphic

Sushi Infographic

I love sushi. But that is only part of the reason I enjoy Sung Hwan Jang’s wonderful sushi infographic. The graphic’s eye pleasing and cartoonish simplcity hit me right in the Chris Ware. Sung has put together all kinds of fun graphical posters detailing everything from pizza to constellations to camping to the Bauhaus art movement.

Sushi Infographic

I’d love to get this poster for my kitchen but I’m unsure how to purchase it from the Korean websites.

Artifacting DOM Tree

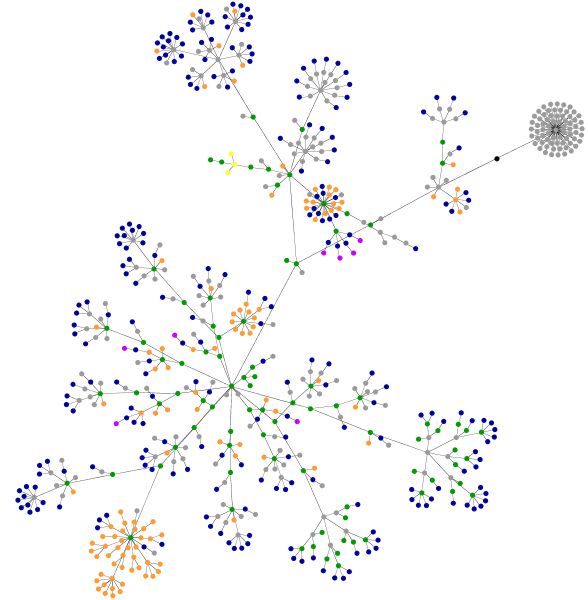
Over at this site you can get a cool graphic representation of your website. Basically, this Java Applet lets you see the HTML tag hierarchy that your site uses to lay out your content. Below is what the DOM tree at Artifacting looks like. What does that mean for people like me and you? Unique, cool, tropical flower-like pictures, I guess. This Flickr set has graphic site-maps for a bunch of other blogs.

Graphic Site Map for Artifacting
blue: for links (the A tag)
red: for tables (TABLE, TR and TD tags)
green: for the DIV tag
violet: for images (the IMG tag)
yellow: for forms (FORM, INPUT, TEXTAREA, SELECT and OPTION tags)
orange: for linebreaks and blockquotes (BR, P, and BLOCKQUOTE tags)
black: the HTML tag, the root node
gray: all other tags

Scroll to Top